
NASA is one of the world’s largest public science-and-exploration organizations, spanning human spaceflight, space science, Earth observation, aeronautics, and technology development. Below is a data-heavy snapshot of NASA statistics covering funding, workforce, mission volume, and space-station research output.
NASA Statistics (Top Highlights)
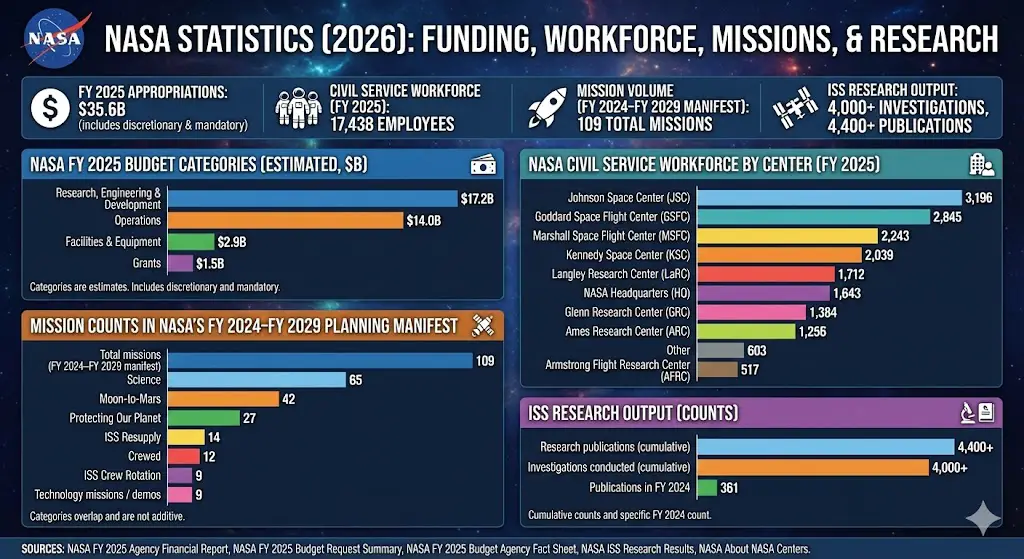
- FY 2025 appropriations: $35.6B (includes $24.838B discretionary appropriations and other appropriated components, including mandatory special appropriations).
- FY 2025 budget mix (est.): $17.2B Research, Engineering & Development (49%) and $14.0B Operations (39%), plus Facilities & Equipment and Grants.
- NASA civil service workforce (FY 2025): 17,438 employees.
- Mission volume (FY 2024–FY 2029 manifest): 109 total missions supported in the planning manifest, including 12 crewed and multiple mission categories (categories are not additive).
- ISS research output: 4,000+ investigations and 4,400+ research publications overall, with 361 publications identified for FY 2024 alone.
NASA Funding Statistics
NASA’s FY 2025 Agency Financial Report summarizes $35.6B in appropriations and provides a high-level breakdown of how the budget is categorized (noting the categories are estimates). The chart below shows the four headline budget categories and their relative size.
NASA FY 2025 Budget Categories (Estimated, $B)
| Label | Bar | Value |
|---|---|---|
| Research, Engineering & Development | $17.2B | |
| Operations | $14.0B | |
| Facilities & Equipment | $2.9B | |
| Grants | $1.5B |
Max = 17.2. Widths: Research, Engineering & Development 100.00%, Operations 81.40%, Facilities & Equipment 16.86%, Grants 8.72%.
NASA Workforce Statistics
NASA’s civil-service headcount is distributed across its major centers and headquarters. The FY 2025 Agency Financial Report reports 17,438 civil servants, with the largest concentrations at Johnson (JSC) and Goddard (GSFC).
NASA Civil Service Workforce by Center (FY 2025)
| Label | Bar | Value |
|---|---|---|
| Johnson Space Center (JSC) | 3,196 | |
| Goddard Space Flight Center (GSFC) | 2,845 | |
| Marshall Space Flight Center (MSFC) | 2,243 | |
| Kennedy Space Center (KSC) | 2,039 | |
| Langley Research Center (LaRC) | 1,712 | |
| NASA Headquarters (HQ) | 1,643 | |
| Glenn Research Center (GRC) | 1,384 | |
| Ames Research Center (ARC) | 1,256 | |
| Other | 603 | |
| Armstrong Flight Research Center (AFRC) | 517 |
Max = 3196. Widths: Johnson Space Center (JSC) 100.00%, Goddard Space Flight Center (GSFC) 89.02%, Marshall Space Flight Center (MSFC) 70.18%, Kennedy Space Center (KSC) 63.80%, Langley Research Center (LaRC) 53.57%, NASA Headquarters (HQ) 51.41%, Glenn Research Center (GRC) 43.30%, Ames Research Center (ARC) 39.30%, Other 18.87%, Armstrong Flight Research Center (AFRC) 16.18%.
NASA Mission Statistics
NASA’s FY 2025 budget summary includes a planning manifest for FY 2024–FY 2029 and states that NASA will support 109 total missions over that period. The same summary lists several mission categories (for example, Science and Moon-to-Mars); these categories overlap, so they are not meant to be summed.
Mission Counts Mentioned in NASA’s FY 2024–FY 2029 Planning Manifest
| Label | Bar | Value |
|---|---|---|
| Total missions (FY 2024–FY 2029 manifest) | 109 | |
| Science | 65 | |
| Moon-to-Mars | 42 | |
| Protecting Our Planet | 27 | |
| ISS Resupply | 14 | |
| Crewed | 12 | |
| ISS Crew Rotation | 9 | |
| Technology missions / demos | 9 |
Max = 109. Widths: Total missions (FY 2024–FY 2029 manifest) 100.00%, Science 59.63%, Moon-to-Mars 38.53%, Protecting Our Planet 24.77%, ISS Resupply 12.84%, Crewed 11.01%, ISS Crew Rotation 8.26%, Technology missions / demos 8.26%.
International Space Station Research Statistics
NASA reports that ISS research has produced 4,000+ investigations and 4,400+ research publications overall, with 361 publications identified in FY 2024. The chart below uses the reported thresholds (4,000 and 4,400) for scale.
ISS Research Output (Counts)
| Label | Bar | Value |
|---|---|---|
| Research publications (cumulative) | 4,400+ | |
| Investigations conducted (cumulative) | 4,000+ | |
| Publications in FY 2024 | 361 |
Max = 4400. Widths: Research publications (cumulative) 100.00%, Investigations conducted (cumulative) 90.91%, Publications in FY 2024 8.20%.
NASA Centers (Quick Context)
NASA operates across a national network of centers and facilities. NASA also states that it has ten Centers, which is useful context when interpreting center-by-center workforce distributions.
Sources
- NASA — Fiscal Year 2025 Agency Financial Report (published Jan 29, 2026): https://www.nasa.gov/wp-content/uploads/2023/11/fy25-afr-final-tagged.pdf
- NASA — Fiscal Year 2025 Budget Request Summary (includes FY 2024–FY 2029 mission planning manifest): https://www.nasa.gov/wp-content/uploads/2024/03/nasa-fiscal-year-2025-budget-summary.pdf
- NASA — FY 2025 Budget Agency Fact Sheet (request total): https://www.nasa.gov/wp-content/uploads/2024/03/fy-2025-budget-agency-fact-sheet.pdf
- NASA — Results published on space station research in 2024 (investigations + publications, and 361 in 2024): https://www.nasa.gov/missions/station/iss-research/science-in-orbit-results-published-on-space-station-research-in-2024/
- NASA — About NASA Centers (ten Centers statement): https://www.nasa.gov/osbp/about-nasa-centers/