Active satellites (often reported as “functioning satellites” or “active payloads”) are spacecraft still providing services in orbit—communications, Earth observation, navigation, science, and more. Because launches and re-entries happen constantly, reputable trackers publish these counts as “as of” snapshots rather than permanent totals.
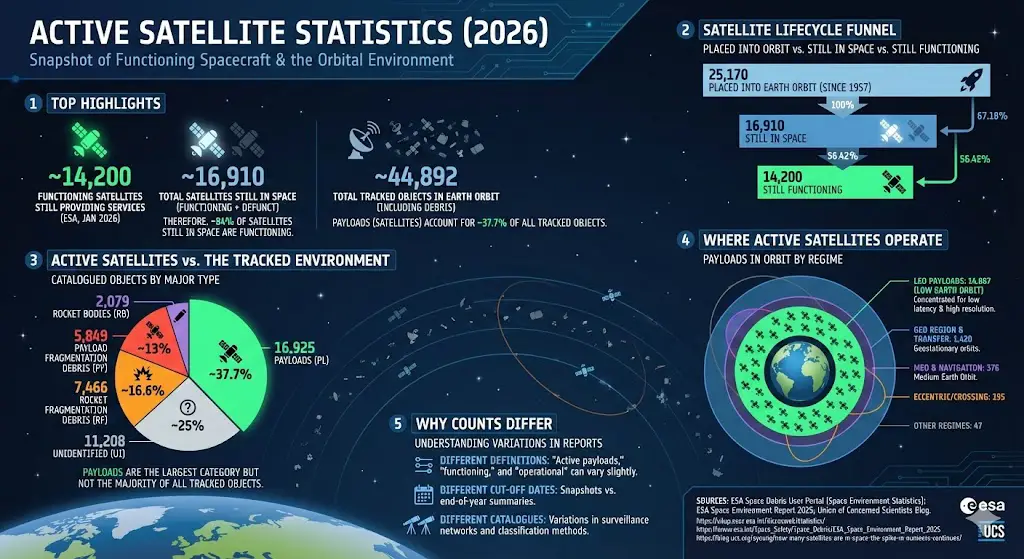
~14,200 satellites are still functioning (ESA space-environment statistics, last update 16 January 2026).
~16,910 satellites are still in space (defunct + functioning), out of ~25,170 satellites placed into Earth orbit since 1957.
That implies roughly 83.97% of satellites still in space are functioning (14,200 out of 16,910).
Space surveillance catalogues track ~44,892 objects in Earth orbit (many tracked objects are rocket bodies and debris, not operational spacecraft).
In ESA’s catalogued object table, payloads = 16,925 out of 44,892 catalogued objects (about 37.70%).
How many active satellites are in orbit?
One of the clearest “active satellite” proxies is functioning satellites. ESA’s space-environment statistics (last updated 16 January 2026) list ~14,200 satellites still functioning. ESA also reports the broader context: how many satellites have been placed into orbit historically, and how many remain in space today.
Satellites placed into orbit vs. still in space vs. still functioning
Label
Bar
Value
Placed into Earth orbit (since 1957)
25,170
Still in space
16,910
Still functioning
14,200
Max = 25,170. Widths: Placed into Earth orbit (since 1957) 100.00%, Still in space 67.18%, Still functioning 56.42%.
Active satellites vs. the tracked space environment
It’s useful to separate active satellites from the broader set of tracked objects (which includes rocket bodies, mission-related objects, and fragmentation debris). ESA’s catalogued object table totals 44,892 objects, and payloads are the single biggest category—but they are not the majority of all tracked objects.
Most operational satellites are concentrated in low-Earth orbit (LEO) because it supports lower latency communications, higher-resolution Earth observation, and cheaper access. ESA’s catalogued object table shows that LEO contains the overwhelming majority of payloads (the category that includes operational satellites).
Payloads in orbit by orbital regime (grouped)
Label
Bar
Value
LEO payloads
14,887
GEO region & transfer
1,420
MEO & navigation
376
Eccentric/crossing
195
Other regimes
47
Max = 14,887. Widths: LEO payloads 100.00%, GEO region & transfer 9.54%, MEO & navigation 2.53%, Eccentric/crossing 1.31%, Other regimes 0.32%.
Why “active satellite” counts differ across reports
Different definitions: “Active payloads,” “functioning satellites,” and “operational satellites” can be close but not identical.
Different cut-off dates: Some publications summarize data through end-of-year periods, while others publish rolling updates.
Different catalogues: Counts can vary depending on which surveillance networks and classification methods are used.
Sources
ESA Space Debris User Portal — Space Environment Statistics: https://sdup.esoc.esa.int/discosweb/statistics/
European Space Agency — ESA Space Environment Report 2025: https://www.esa.int/Space_Safety/Space_Debris/ESA_Space_Environment_Report_2025
Union of Concerned Scientists blog — satellite count explainer: https://blog.ucs.org/syoung/how-many-satellites-are-in-space-the-spike-in-numbers-continues/